[Case 03]

Web Application Monitoring

Agriculture

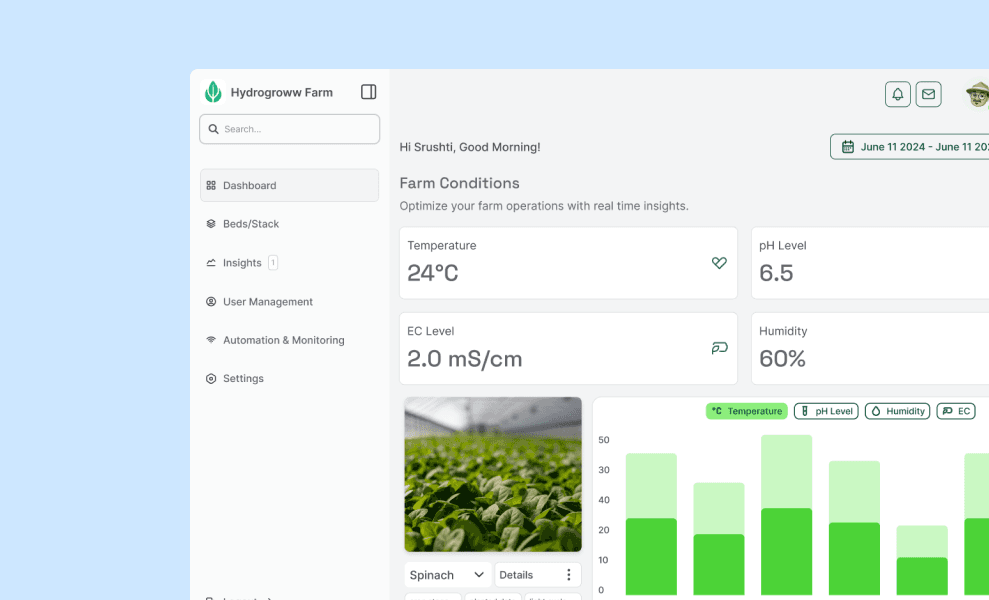
Hydrogrow Web Application

Web application designed to monitor and control the farm.

[Project Overview]

Designed a comprehensive web-based dashboard to manage and monitor hydroponic farming operations, aimed at delivering data-driven insights and streamlined control for indoor growers.

The interface is built for clarity, responsiveness, and real-time interaction with farm IoT sensors.

[Industry]

Agriculture

[My Role]

UX/UI Designer

[Platforms]

Desktop

[Timeline]

February 2025 - March 2025

[Persona]

Age: 29

Location: Jaipur

Tech Proficiency: Moderate

Gender: Male

Arav Singh

Small Farm Owner

I just want to see whole thing like — the main insights on the dashboard only.

[Process]

[01] User Research

Conducted user interviews with 25 participants withing farming field to understand their frustrations and preferences.

Analyzed user behavior data to pinpoint where users dropped off in the process.

Benchmarked against competitors to identify best practices for checkout flows.

[01] User Research

Conducted user interviews with 25 participants withing farming field to understand their frustrations and preferences.

Analyzed user behavior data to pinpoint where users dropped off in the process.

Benchmarked against competitors to identify best practices for checkout flows.

[01] User Research

Conducted user interviews with 25 participants withing farming field to understand their frustrations and preferences.

Analyzed user behavior data to pinpoint where users dropped off in the process.

Benchmarked against competitors to identify best practices for checkout flows.

[02] Insights

User-friendly dashboard for 24x7 farm monitoring

Easy-to-read graphs showing moisture, nutrient levels, and temperature trends

Simple watch UI with smiley/alert indicators

[02] Insights

User-friendly dashboard for 24x7 farm monitoring

Easy-to-read graphs showing moisture, nutrient levels, and temperature trends

Simple watch UI with smiley/alert indicators

[02] Insights

User-friendly dashboard for 24x7 farm monitoring

Easy-to-read graphs showing moisture, nutrient levels, and temperature trends

Simple watch UI with smiley/alert indicators

[04] Testing & Iteration

Conducted A/B testing with 30 users, comparing the original and redesigned flows.

Gathered feedback through usability testing and refined the design based on user input.

Designed a desktop-first layout.

[04] Testing & Iteration

Conducted A/B testing with 30 users, comparing the original and redesigned flows.

Gathered feedback through usability testing and refined the design based on user input.

Designed a desktop-first layout.

[04] Testing & Iteration

Conducted A/B testing with 30 users, comparing the original and redesigned flows.

Gathered feedback through usability testing and refined the design based on user input.

Designed a desktop-first layout.

[Outcome]

Users can easily check all the neccessary data at a glance.

Users can easily check all the neccessary data at a glance.

Simple and clean UI designs.

Simple and clean UI designs.

Action based alerts.

Action based alerts.

[Key Learnings]

Simplification is key

Keeping it simple gives users freehand to travel through ui.

Simplification is key

Keeping it simple gives users freehand to travel through ui.

Simplification is key

Keeping it simple gives users freehand to travel through ui.

Users value a clean, easy to read ui.

Clean and neat ui stays on top.

Users value a clean, easy to read ui.

Clean and neat ui stays on top.

Users value a clean, easy to read ui.

Clean and neat ui stays on top.

Select this text to see the highlight effect